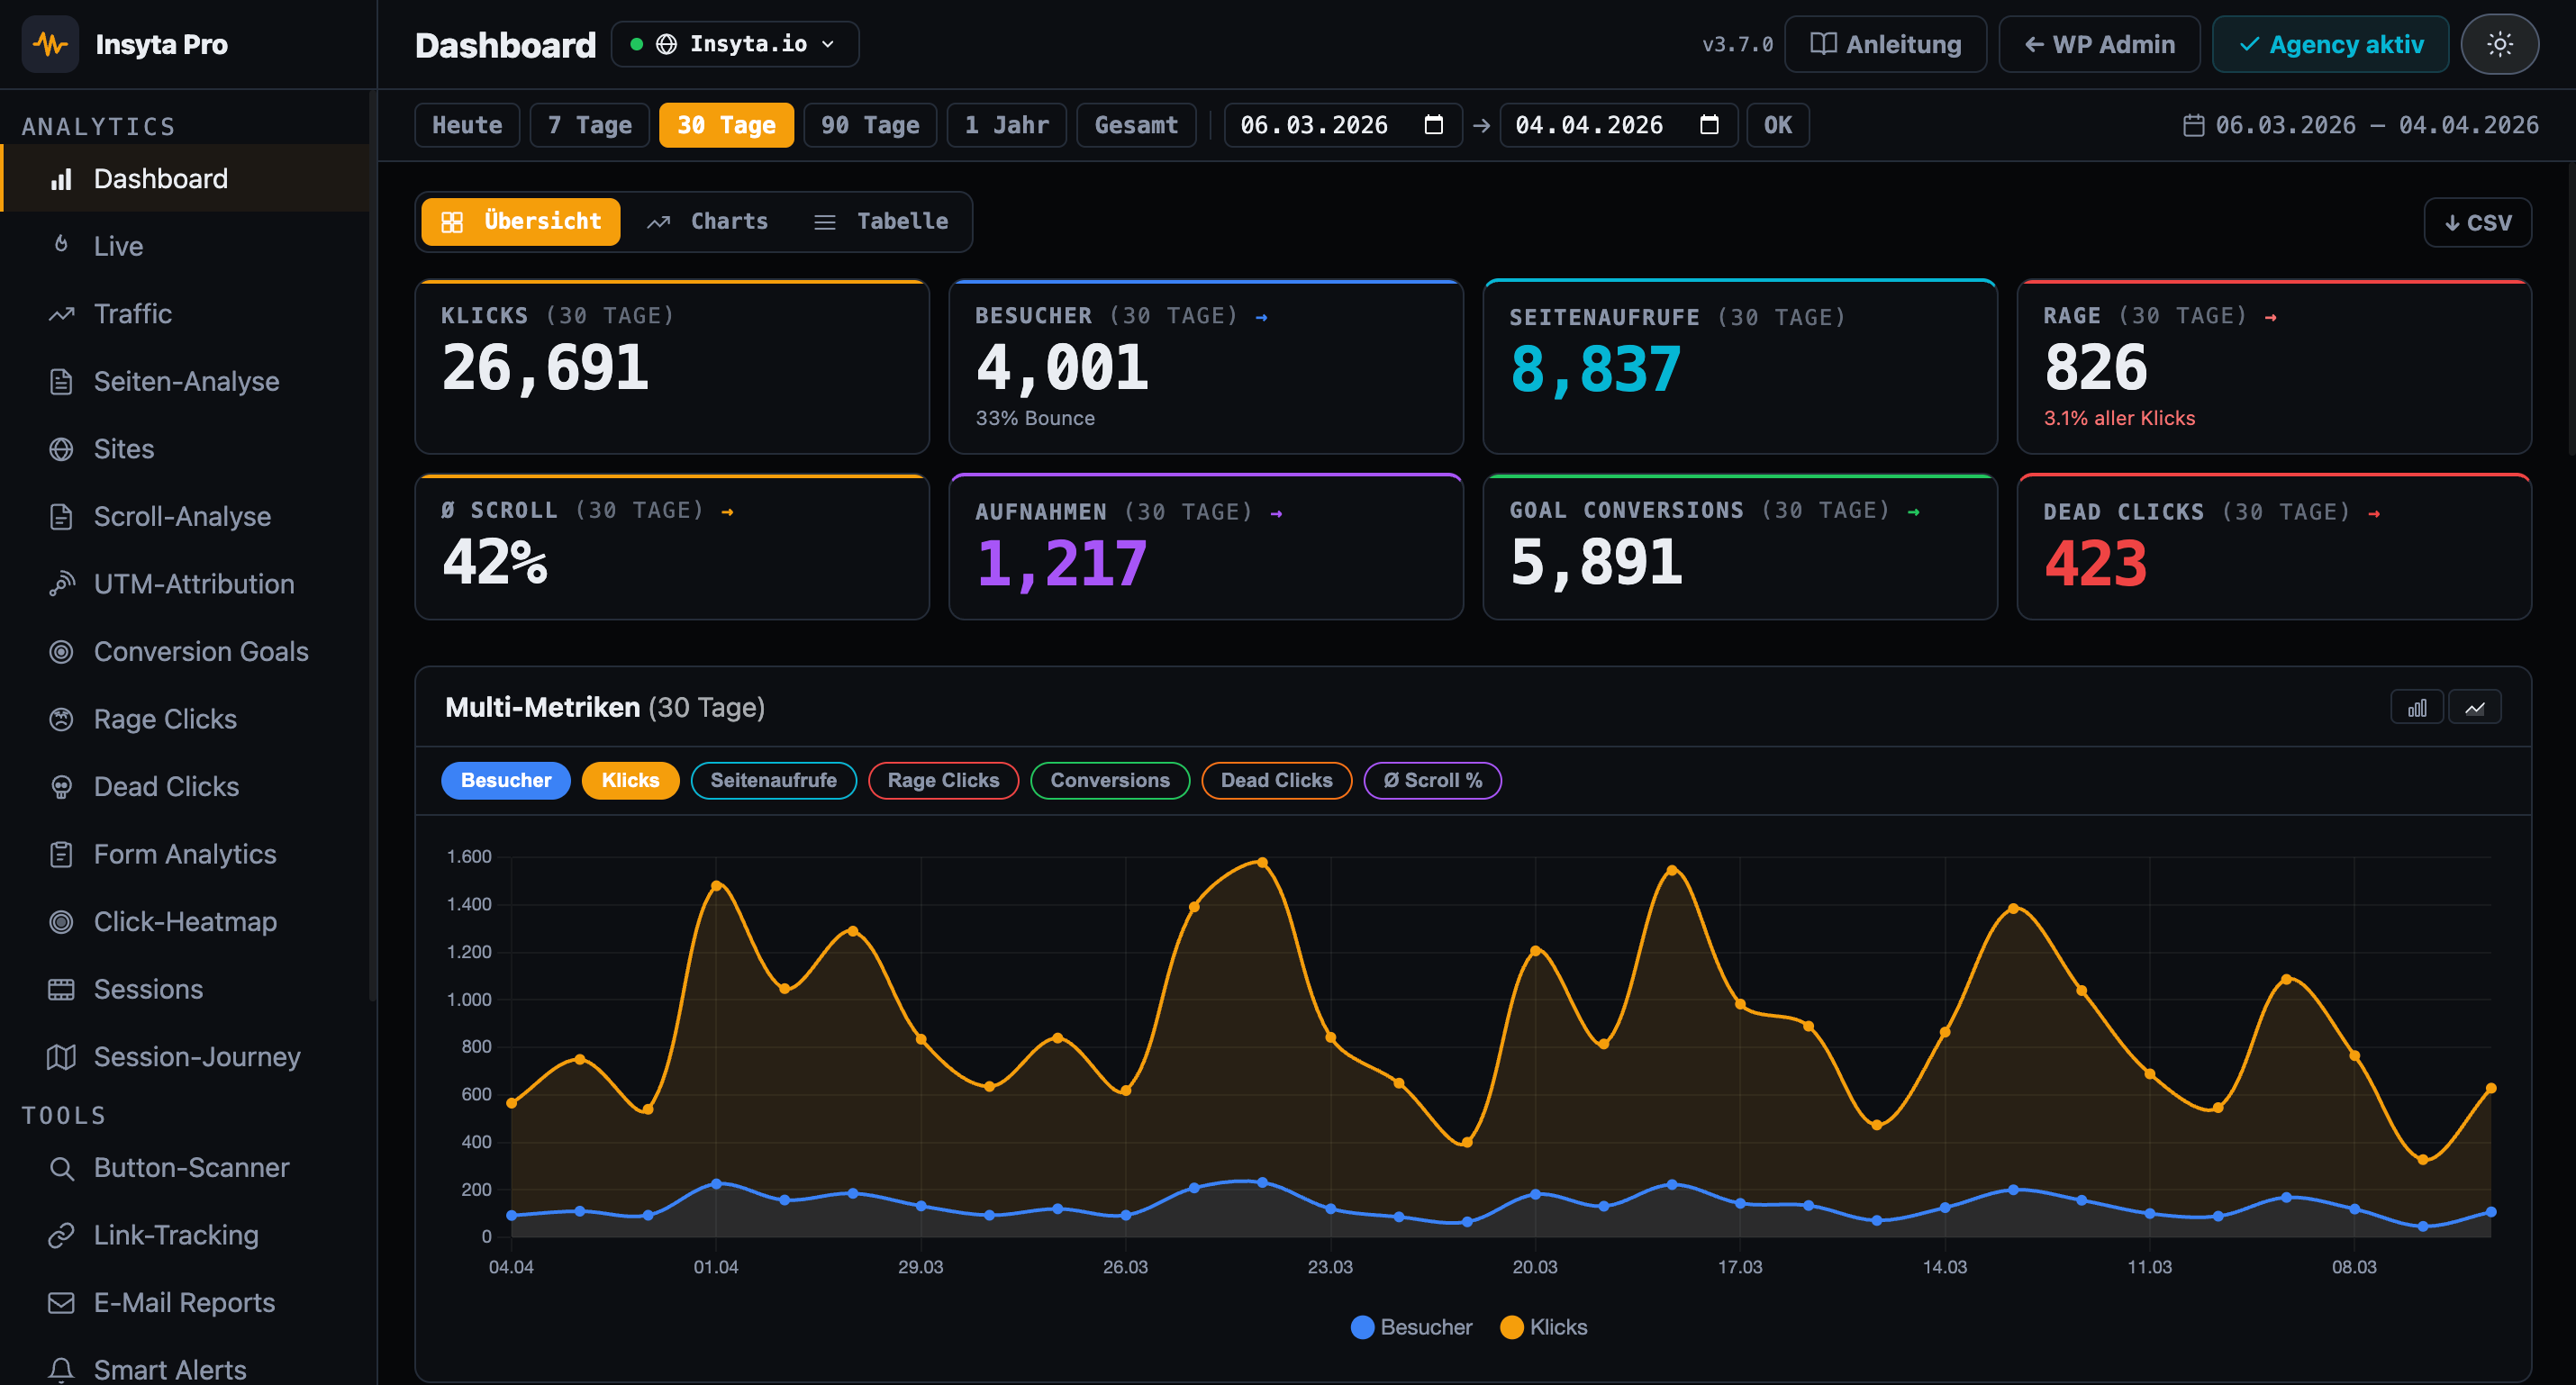
Visitors, pageviews, bounce rate, session duration, traffic sources and top pages — directly in your WordPress database, no external services, no privacy issues.
14-day money-back · Cancel anytime · GDPR-compliant · Local in WordPress
Traffic Analytics shows you classic website metrics directly in your WordPress dashboard: How many visitors come? From where? To which pages? How long do they stay? What is the bounce rate? — all without external service, GDPR-compliant in your own database.
Google Analytics sends data to US servers — GDPR issue. Matomo requires self-hosting setup. Insyta Pro stores everything locally in WordPress and starts at 6 €/month.
| Feature | Insyta Pro | Hotjar | GA4+GTM | MS Clarity |
|---|---|---|---|---|
| Click tracking | ✓ | ✓ | ✓ complex | ✗ |
| Click heatmap | ✓ Canvas overlay | ✓ from 39 €+/mo | ✗ | ✓ US servers |
| Scroll tracking | ✓ + Scroll Map | ✓ | ✗ | ✓ |
| Session recordings | ✓ local | ✓ from 39 €+/mo | ✗ | ✓ US servers |
| Session journey | ✓ local | ✗ | ✗ | ✗ |
| Real-time dashboard | ✓ Live counter + sessions | ✗ | ✓ but complex | ✗ |
| Rage click detection | ✓ | ✓ | ✗ | ✓ |
| Dead click detection | ✓ | ✗ | ✗ | ✗ |
| Form analytics | ✓ | partial | ✗ | ✗ |
| Conversion goals | ✓ | partial | ✓ complex | ✗ |
| A/B test tracker | ✓ | ✗ | ✗ | ✗ |
| UTM attribution | ✓ | ✗ | ✓ | ✗ |
| Traffic analytics | ✓ | ✗ | ✓ | ✗ |
| Page analytics (per URL) | ✓ | ✗ | ✗ | ✗ |
| Dwell time per scroll zone | ✓ | ✗ | ✗ | ✗ |
| Email reports | ✓ | ✗ | ✗ | ✗ |
| Smart alerts | ✓ | ✗ | ✗ | ✗ |
| Link & CTA tracking | ✓ | partial | ✓ complex | ✗ |
| Button scanner | ✓ | ✗ | ✗ | ✗ |
| Multi-site dashboard | ✓ Agency | ✗ | ✗ | ✗ |
| White-Label Addon | ✓ Agency | ✗ | ✗ | ✗ |
| Self-hosted (your server) | ✓ 100% | ✗ | ✗ | ✗ Microsoft cloud |
| GDPR compliant / cookieless | ✓ | ⚠ limited | ⚠ limited | ⚠ Microsoft data sharing |
| No data to third parties | ✓ | ✗ | ✗ | ✗ |
| WordPress-native | ✓ | ✗ | ✗ | ✗ |
| Price | from 6 €/mo | from 39 €/mo | Free + setup work | Free* |
Unique sessions as visitors + total pageviews in a 60-day chart
Color-coded: green < 50%, yellow up to 70%, red above — instantly recognizable
Average session duration calculated from time_on_page of all pages per session
Direct / Organic / Social / Email / Referral — automatically classified from referrer URL
Pageviews + avg time per page as bar chart and full table
Where do visitors arrive? Shows the most visited landing pages of your site
Where do visitors leave the site? Critical for conversion optimization
Desktop / Mobile / Tablet + Chrome / Firefox / Safari / Edge + Windows / macOS / iOS / Android
Custom branding, logo & colors for the plugin dashboard. Available separately for Agency licenses.
See which product pages get the most traffic and where visitors drop off — without Google Analytics.
Show clients real traffic data from the WP database — without consent banners, without privacy discussions.
Measure whether email campaigns bring real visitors — traffic sources show "Email" as its own category.
See if organic traffic is growing — without GA4 learning curve, directly in the WordPress dashboard.
Measure how much traffic really comes from Facebook, Instagram or LinkedIn — without UTM tags.
Reporting for all client sites from one dashboard — without setting up Google Analytics for every client.
Cancel anytime
Cancel anytime · 14-day money back
Visitors · Bounce Rate · Traffic Sources · Top Pages · Devices · Browser — directly in WordPress
14-day money-back guarantee · Lifetime updates · Support in English and German