Real-time Dashboard Feature — New in v2.9.2
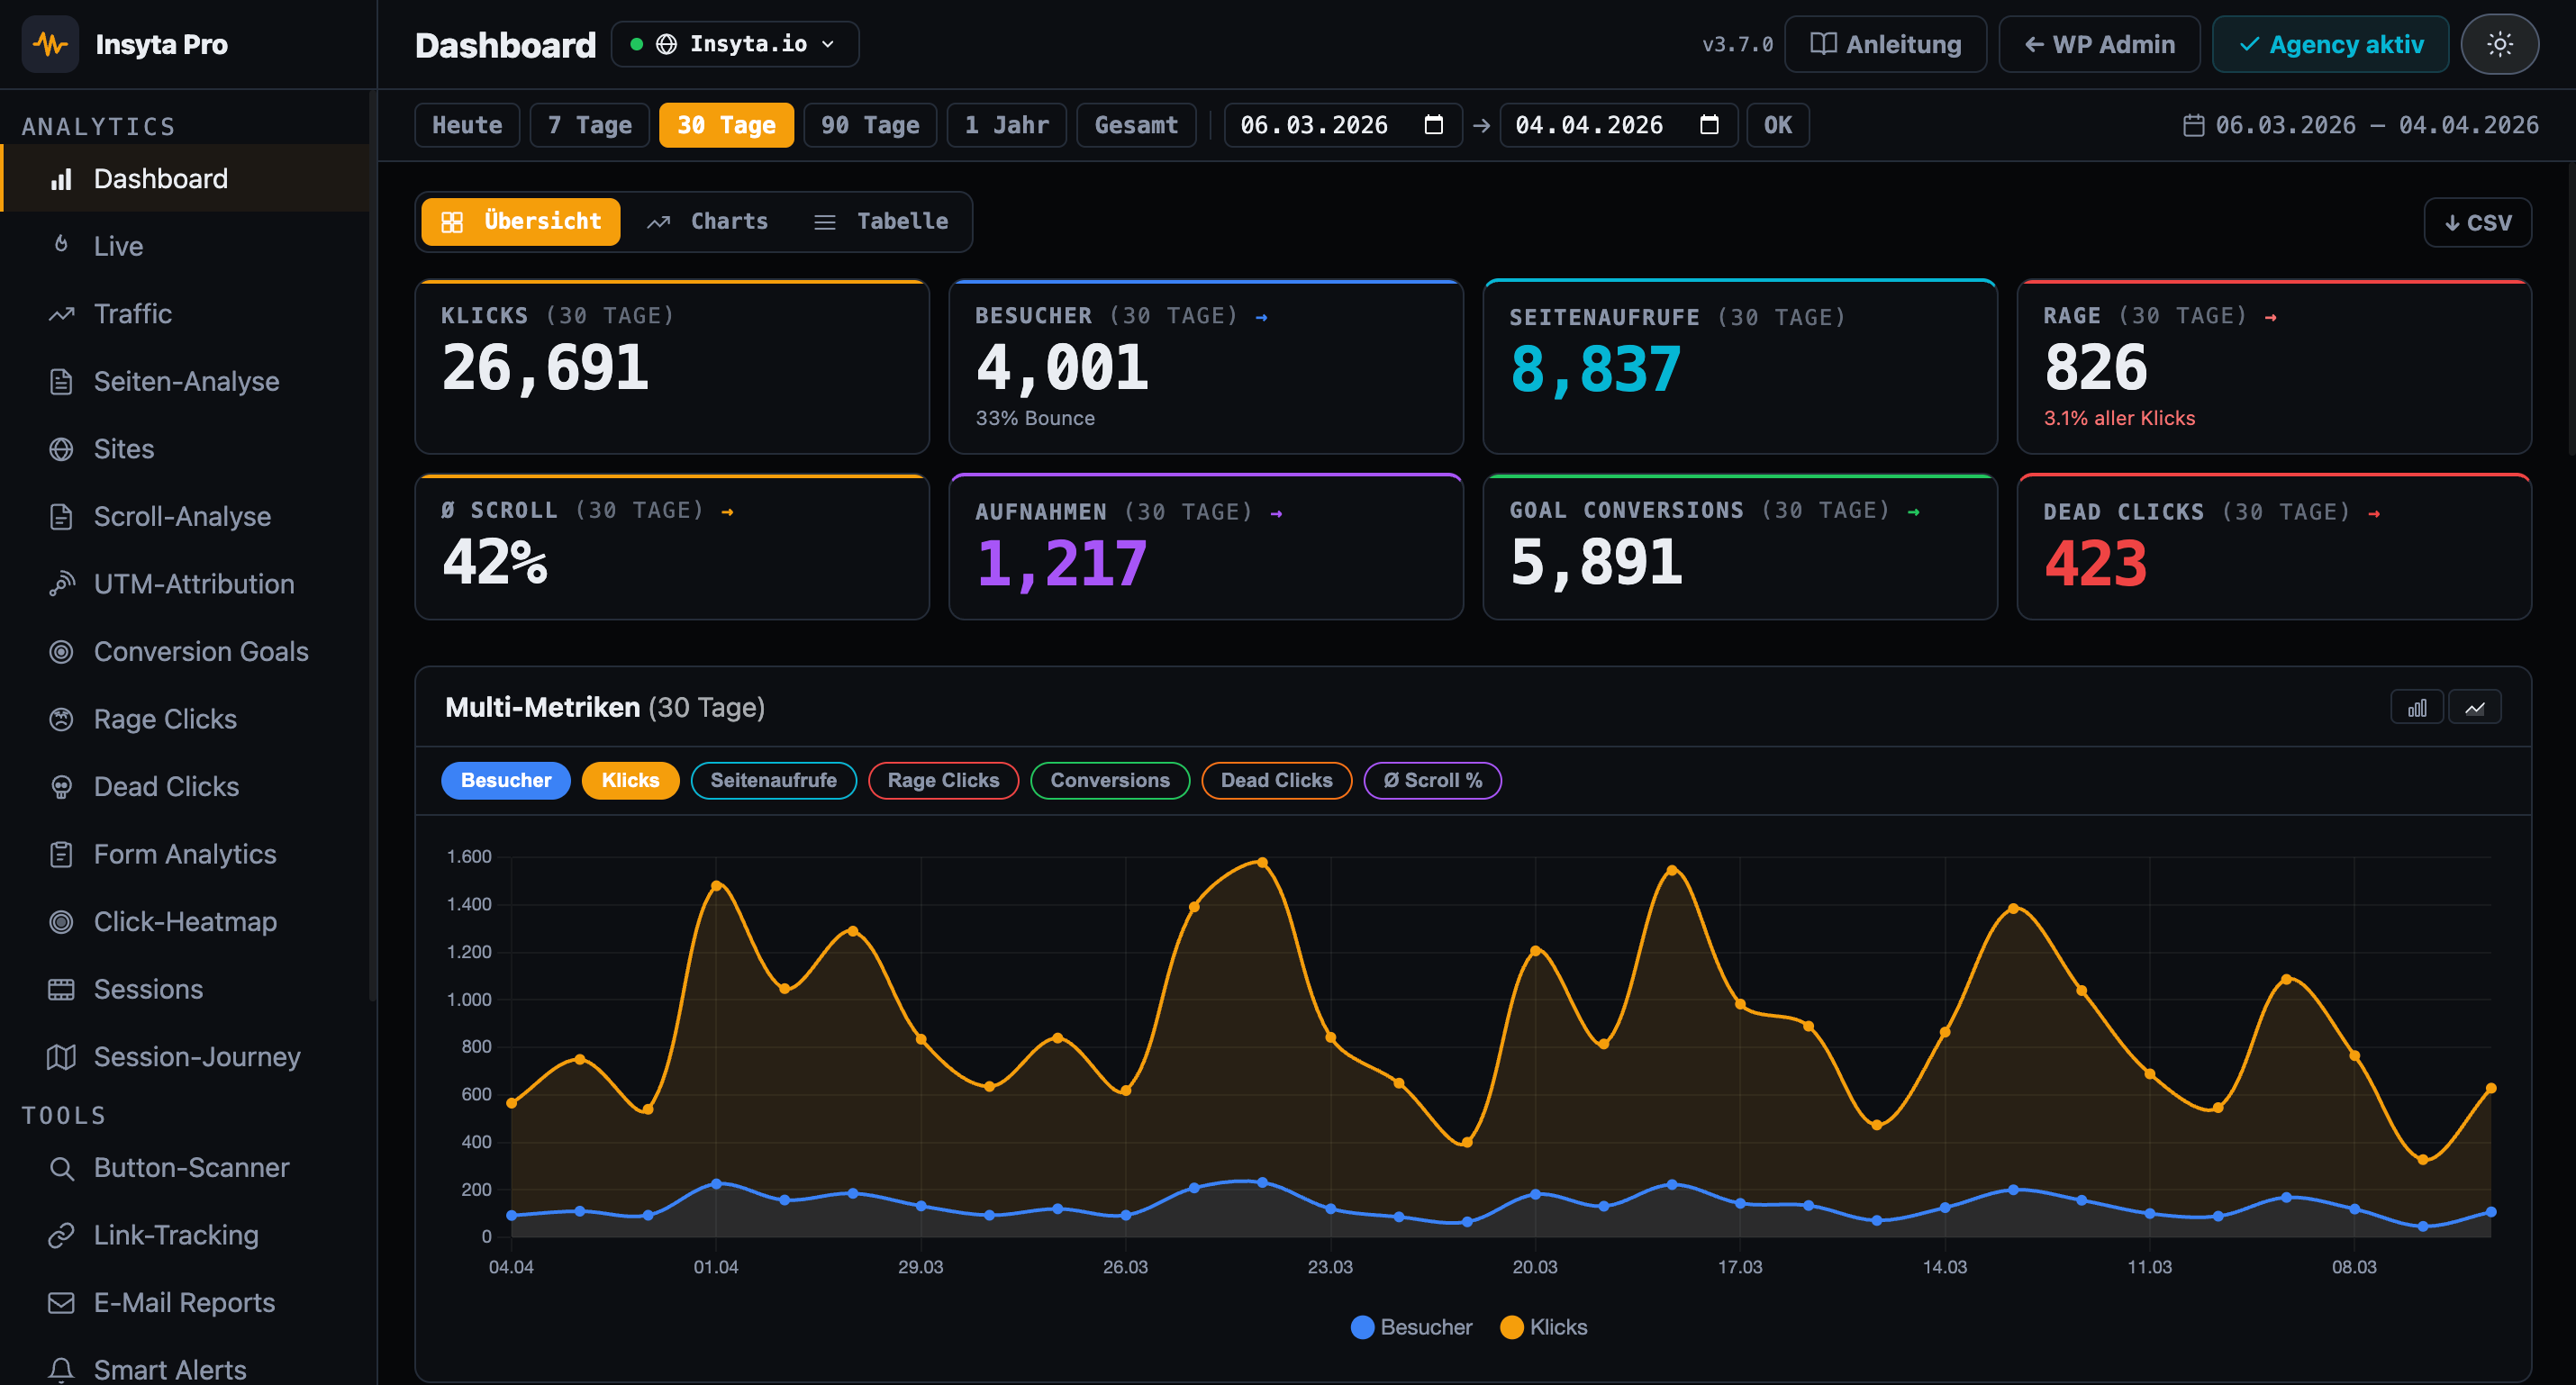
WordPress Live Analytics — Real-time dashboard from first pageload
The real-time dashboard shows you every visitor live: Which pages they view, which elements they click, how long they stay. Heartbeat tracking captures sessions from the first second — directly in WordPress, without Google Analytics.
14-day money-back · Cancel anytime · GDPR-compliant · Local in WordPress