All Features
32+ Features for Professional Analytics
From live visitors to multi-site dashboard — all Insyta Pro features in detail.
From live visitors to multi-site dashboard — all Insyta Pro features in detail.
See in real-time how many visitors are currently active on your website — from the first pageload, not just after first click. The large animated counter shows the number of online visitors (active in the last 5 minutes). Below a live stream of the latest 50 sessions with LIVE badge for sessions under 1 minute. Click on a session to see expandable details: All visited pages (with Entry/Exit markers), all clicked buttons, session duration, browser/OS/device. The dashboard auto-refreshes every 3 seconds — perfect for campaign launches, live events or Black Friday traffic monitoring.
Sessions are captured immediately on pageload through a heartbeat system (every 10 seconds). Each session shows: Current page, device (Desktop/Mobile/Tablet), browser (Chrome/Firefox/Safari), OS (Windows/macOS/Linux), click count, page count and session duration. Green blinking LIVE badges mark sessions less than 1 minute old. Expandable details show the complete journey with all visited pages and all clicked buttons — everything live without tab switching.
Tracks every click on buttons, links, CTAs and all interactive elements. Works with all page builders (Elementor, Divi, Gutenberg, Bricks). Use simple CSS selectors or add .insyta-track to your elements. No complicated Tag Manager configuration — install, activate, done.
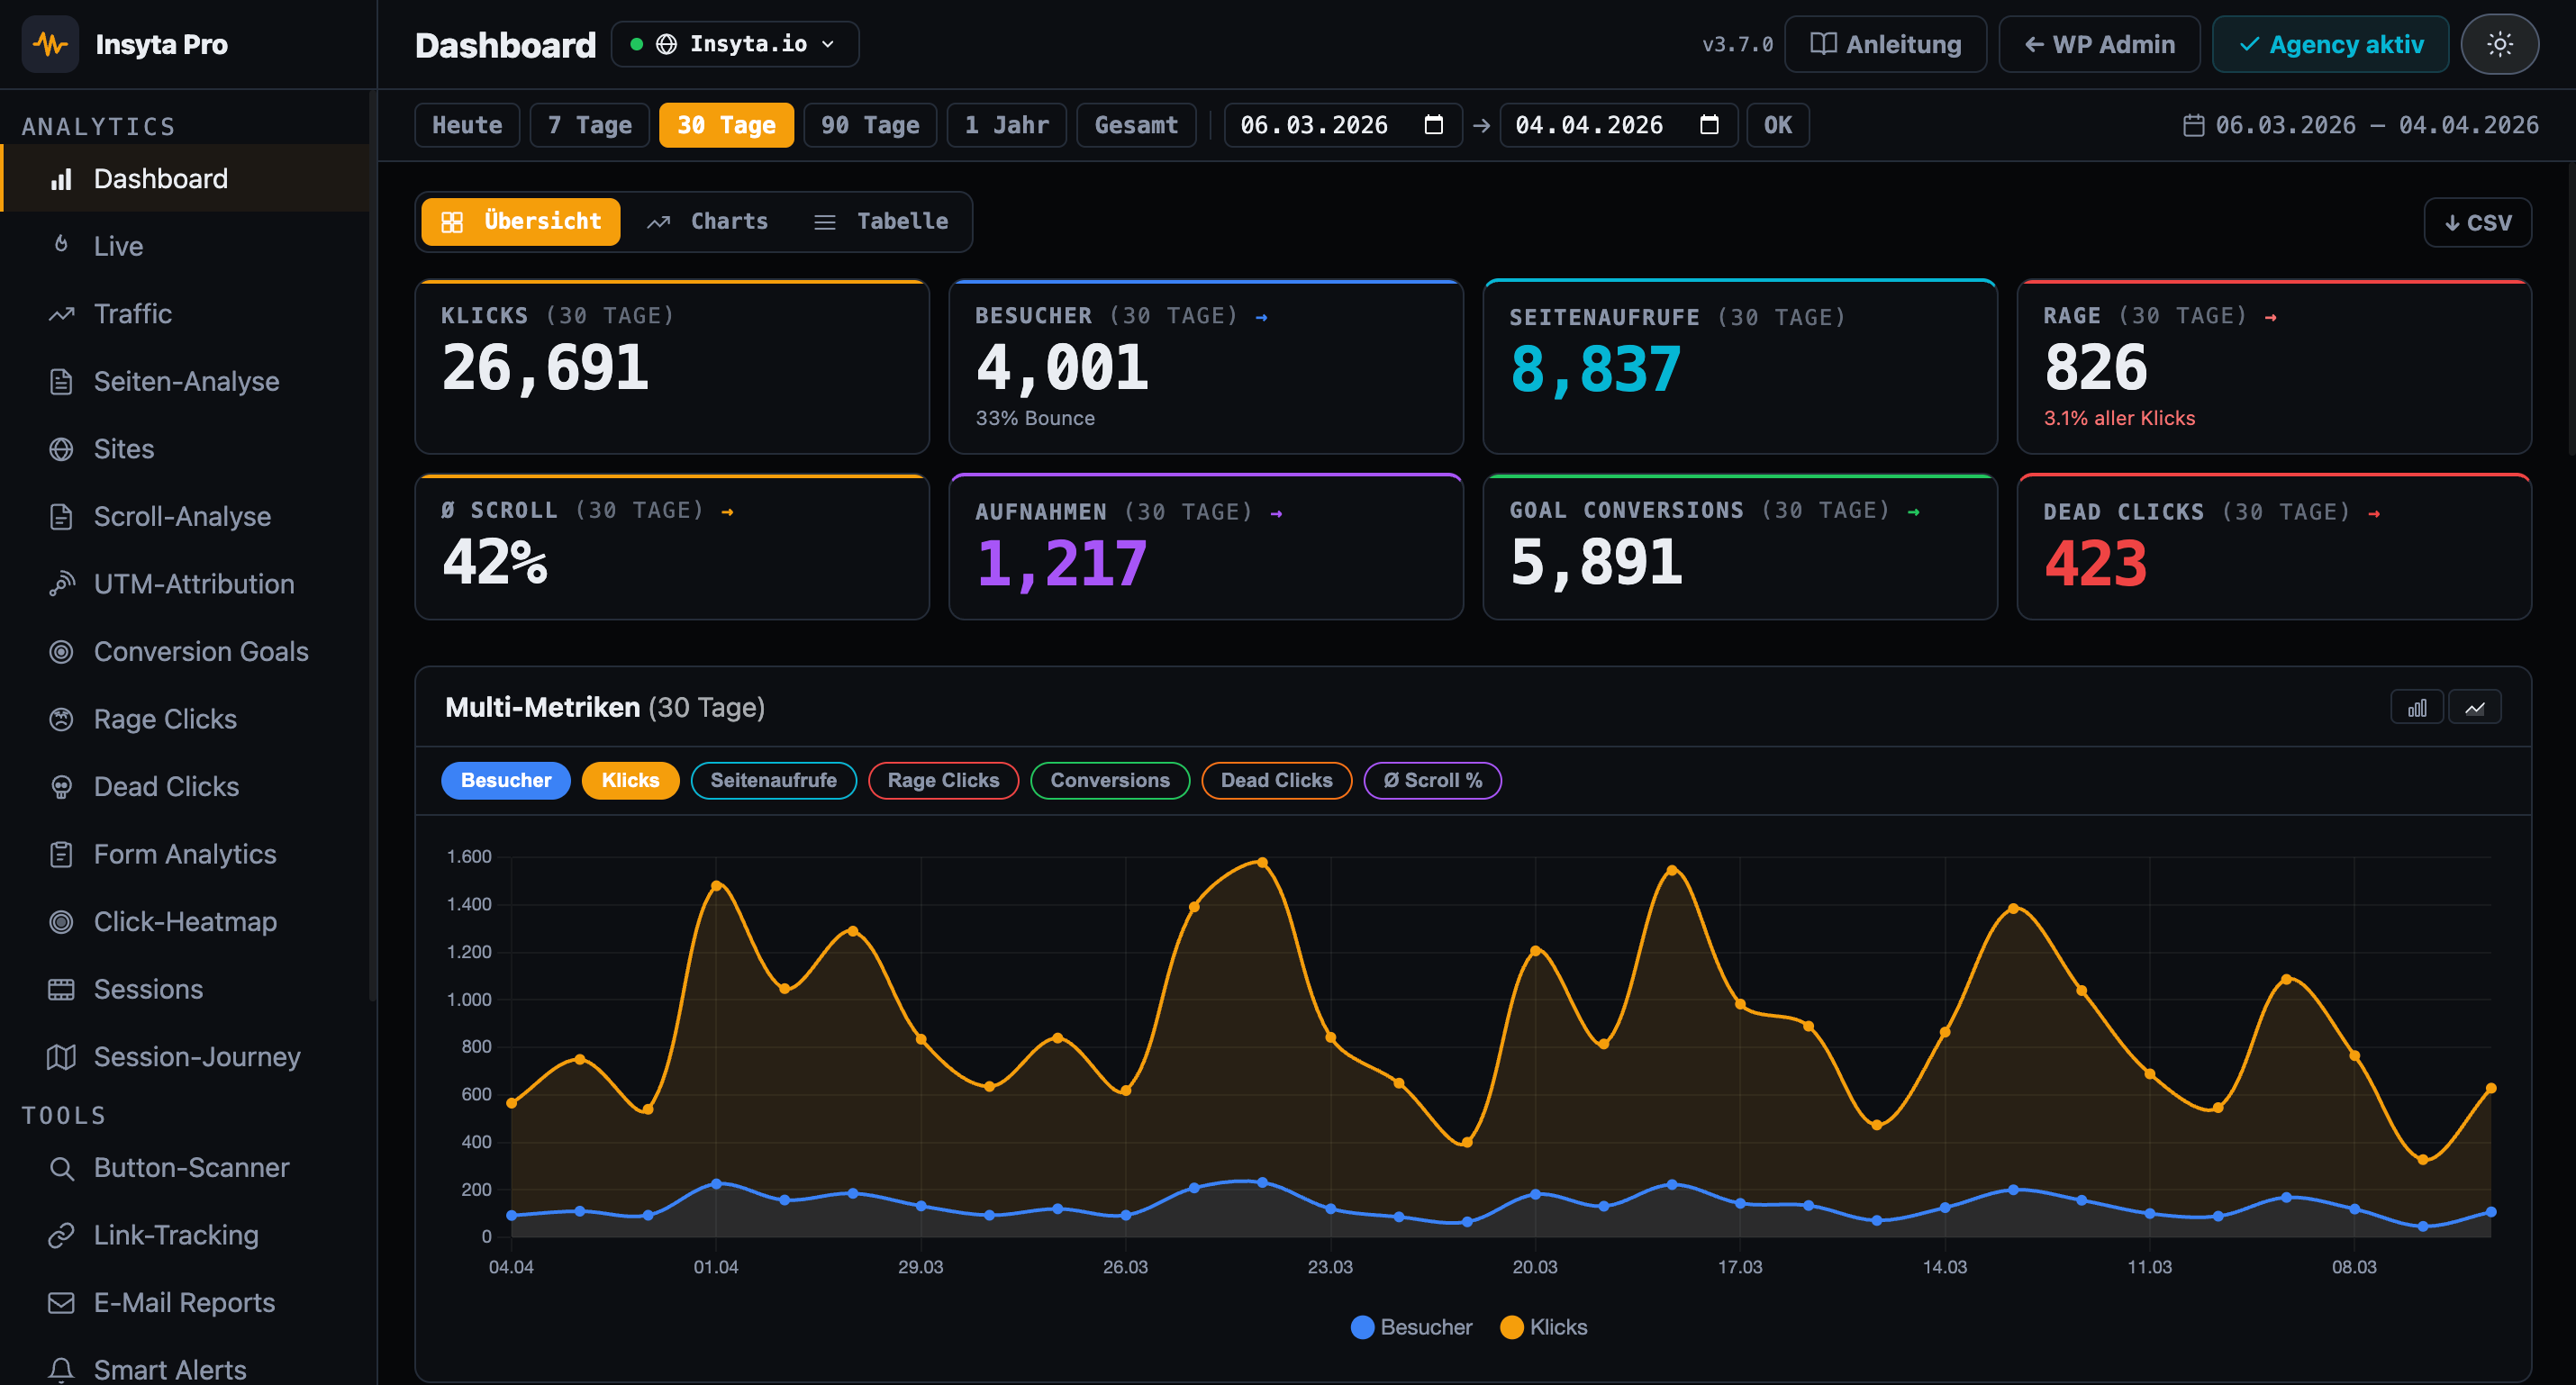
Complete analytics dashboard with 4 main KPIs (clicks, today, unique, rage), click chart over 30 days, top buttons ranking, device and browser breakdown. Filter by any time period: Today, 7d, 30d, 90d, 1y or Custom. Export all data as CSV with all fields (button ID, text, page, device, browser, UTM, timestamp).
Measures how far visitors scroll on each page. 5 configurable milestones (default: 25%, 50%, 75%, 90%, 100%) show you exactly where visitors stop reading. Data split by Desktop, Mobile and Tablet — so you see if mobile users scroll less. Average scroll depth per page with bar chart and CSV export.
Define unlimited conversion goals based on button IDs or CSS selectors. Examples: purchase button, newsletter signup, contact form submit, download link. See for each goal: total hits in period, conversion rate (%) and mini trend bar. Combine goals with A/B tests to find the winner.
Compare two button variants with real click data. Enter the CSS selectors for variant A and B, Insyta Pro counts clicks separately. Statistical winner is automatically calculated with chi-squared test and 95% confidence interval. So you see not only which variant has more clicks, but whether the difference is statistically significant.
Detects frustrated users automatically. A rage click is registered when the same element is clicked 3+ times within 2 seconds (configurable). Hotspot table shows buttons with the most rage clicks as bar chart — these are your most urgent UX problems. Most common causes: button not responding, page loads too slowly, link is broken or element looks clickable but isn't.
Automatic reports by email: daily, weekly or monthly. Each report contains: top buttons by clicks, total click counts, rage clicks, conversion rate and period comparison. Custom subject configurable, selectable sections (only what you need), multiple email recipients possible. Perfect to keep your team or clients updated without looking at the dashboard.
Proactive anomaly detection with email and Slack notifications. 5 alert types: rage click spike, traffic drop, new dead clicks, conversion drop and form abandonment spike. Rolling 7-day baselines automatically calculate the normal state — anomalies are detected by comparing the current time window. Cooldown system prevents alert spam. Checkable hourly or every 6 hours.
Click coordinates as colored canvas overlay directly on the real page. No external service, no third parties — everything runs locally in your WordPress database. Color coding: Blue = few clicks, Green = medium, Yellow/Orange = many, Red = hotspot. Works correctly at different viewport widths and after scrolling. Simply open the heatmap overview, click " Show Heatmap" and see immediately where users click.
Records mouse movements, clicks and scrolls in real-time. Replay with animated cursor trail, click effects (green ripple for normal clicks, red burst for rage clicks) and timeline scrubber for fast-forward and rewind. See exactly what the visitor did: Where did they hesitate? Where did they click? Which areas did they skip? Perfect for identifying UX issues that aren't visible in numbers.
Shows the complete path of every visitor as a clickable timeline: entry page, all visited pages in chronological order, time on page, scroll depth at exit (in %), and clicks on that page. So you don't just see individual pages in isolation, but the entire user flow: Where do visitors come from? Which pages do they visit in sequence? Where do they drop off?
Visual overlay directly on the real page with color stripes (Green → Yellow → Red) and milestone lines. Green = many visitors saw this area, Yellow = medium, Red = only few scrolled this far. Horizontal lines at 25%, 50%, 75%, 90%, 100% show the milestones. Simply open the Scroll Map with ?insyta_p_sm=1 and see immediately: Where do visitors lose interest? Where should I place important CTAs?
Measures how many seconds visitors spend in each scroll zone: 0–25% (Above the Fold), 25–50% (upper middle), 50–75% (lower middle), 75–100% (footer area). Color-coded with interpretation tip: Green = users reading actively, Yellow = average interest, Red = fast scrolling. So you see not only how far people scroll, but also whether the content is actually being read.
Every click is automatically stored with UTM parameters. The 5 standard parameters: utm_source (source: google, newsletter), utm_medium (channel: cpc, email), utm_campaign (campaign name), utm_term (keyword), utm_content (variant). Cookie-based tracking over 24h — if a user comes via a UTM link and clicks on page 2, the click is still correctly attributed. Filter in the UTM dashboard by Source, Medium or Campaign to see which channel performs best.
Create UTM links directly in the plugin — no external tools needed. Enter target URL, source, medium, campaign, term and content. The final URL is shown as a live preview and can be copied with one click. Perfect for creating campaign URLs for Facebook Ads, newsletters or Google Ads and tracking performance directly in Insyta.
Tracks not only classic buttons, but also: links to external pages, phone numbers (tel:), email links (mailto:), download links, and all <a> elements. Automatic detection of all links on your page or manual watch list for targeted monitoring. See which links are clicked most frequently and which CTAs convert — whether button, link or text link.
Automatically scans your pages and detects trackable elements. Simply enter a URL and the scanner searches the page for all clickable elements: buttons, links, input submit fields, CTAs. Shows you button ID, text, and selector. One click on "Add to Selectors" and the button is tracked from now on — without having to search manually in the code.
Detects clicks on elements that are not interactive — no link, no button, no JavaScript handler. When users click on an image, text span or div because they think it is clickable, it is recorded as a dead click. The dead-click table shows element tag, text, CSS path and click count per page — helping you quickly find which elements falsely appear interactive.
Automatic tracking of all HTML forms without code changes. Insyta Pro measures: form starts, field dwell time, field abandonment, form abandonment and submits. The submit rate shows how well your form converts. The Top drop-off fields section shows which inputs cause users to abandon.
Classic website statistics directly in your WordPress DB — no Google Analytics needed. Shows visitors, pageviews, bounce rate (color-coded), avg session duration, 60-day chart, traffic sources (Direct/Organic/Social/Email/Referral), top pages with avg time, entry & exit pages as well as devices, browsers and OS.
Connect unlimited WordPress sites to your main site (Agency license required). Each remote site appears in the Sites list with: name, URL, last activity and click count. Click " Details →" to open a modal dashboard with 10 complete analytics tabs: Overview, Click Log, Scroll, UTM, Rage, Heatmap, Sessions, Journey, Links, Goals. Everything centrally in one place — no more jumping between sites.
Secure connection between main site and remote sites via remote token. Copy the token from your main site (Insyta Pro → Sites), paste it on the remote site (Insyta Pro → Settings → Multi-Site), done. The remote site now sends all tracking data to the main site. Test the connection with one click — if ✓ green appears everything is correct.
Switch between connected remote sites instantly via a dropdown in the topbar — without navigating back to the Sites list. The switcher appears in the dashboard tab and in the sites detail view. Shows all connected sites with status dot and URL. Ideal for agencies switching between client sites.
Available separately for Agency licenses: Replace the plugin name, logo and colors with your own branding. Custom email sender for reports, hideable menu items and a fully branded dashboard for client projects. Branded email reports are already included in the Agency license.
Exclude admins and specific pages from tracking — so your own clicks don't skew the stats. Two options: (1) Exclude admins: All logged-in users with administrator role are not tracked. (2) Page exclusions: Enter URLs or URL parts (e.g. /thank-you/, /admin/, /cart/) — clicks on these pages are ignored. Perfect for excluding test pages or internal areas.
Delete data selectively by area instead of all at once: click log, scroll data, heatmap coordinates, session recordings, journey data, link tracking, UTM attribution, goals or rage clicks. Select an area, click "Delete", done. Or delete everything with one click via "Delete All Data". This way you can remove old test data without losing your valuable production data.
Automatically sends all click events to Google Analytics 4 and Google Tag Manager. Event name: "insyta_click", event parameters: button_id, button_text, page_url, device, utm_source, utm_medium, utm_campaign. So you have Insyta Pro's detailed dashboard AND your data in GA4 — the best of both worlds. Simply enable the toggle in settings, add your GA4 ID, done.