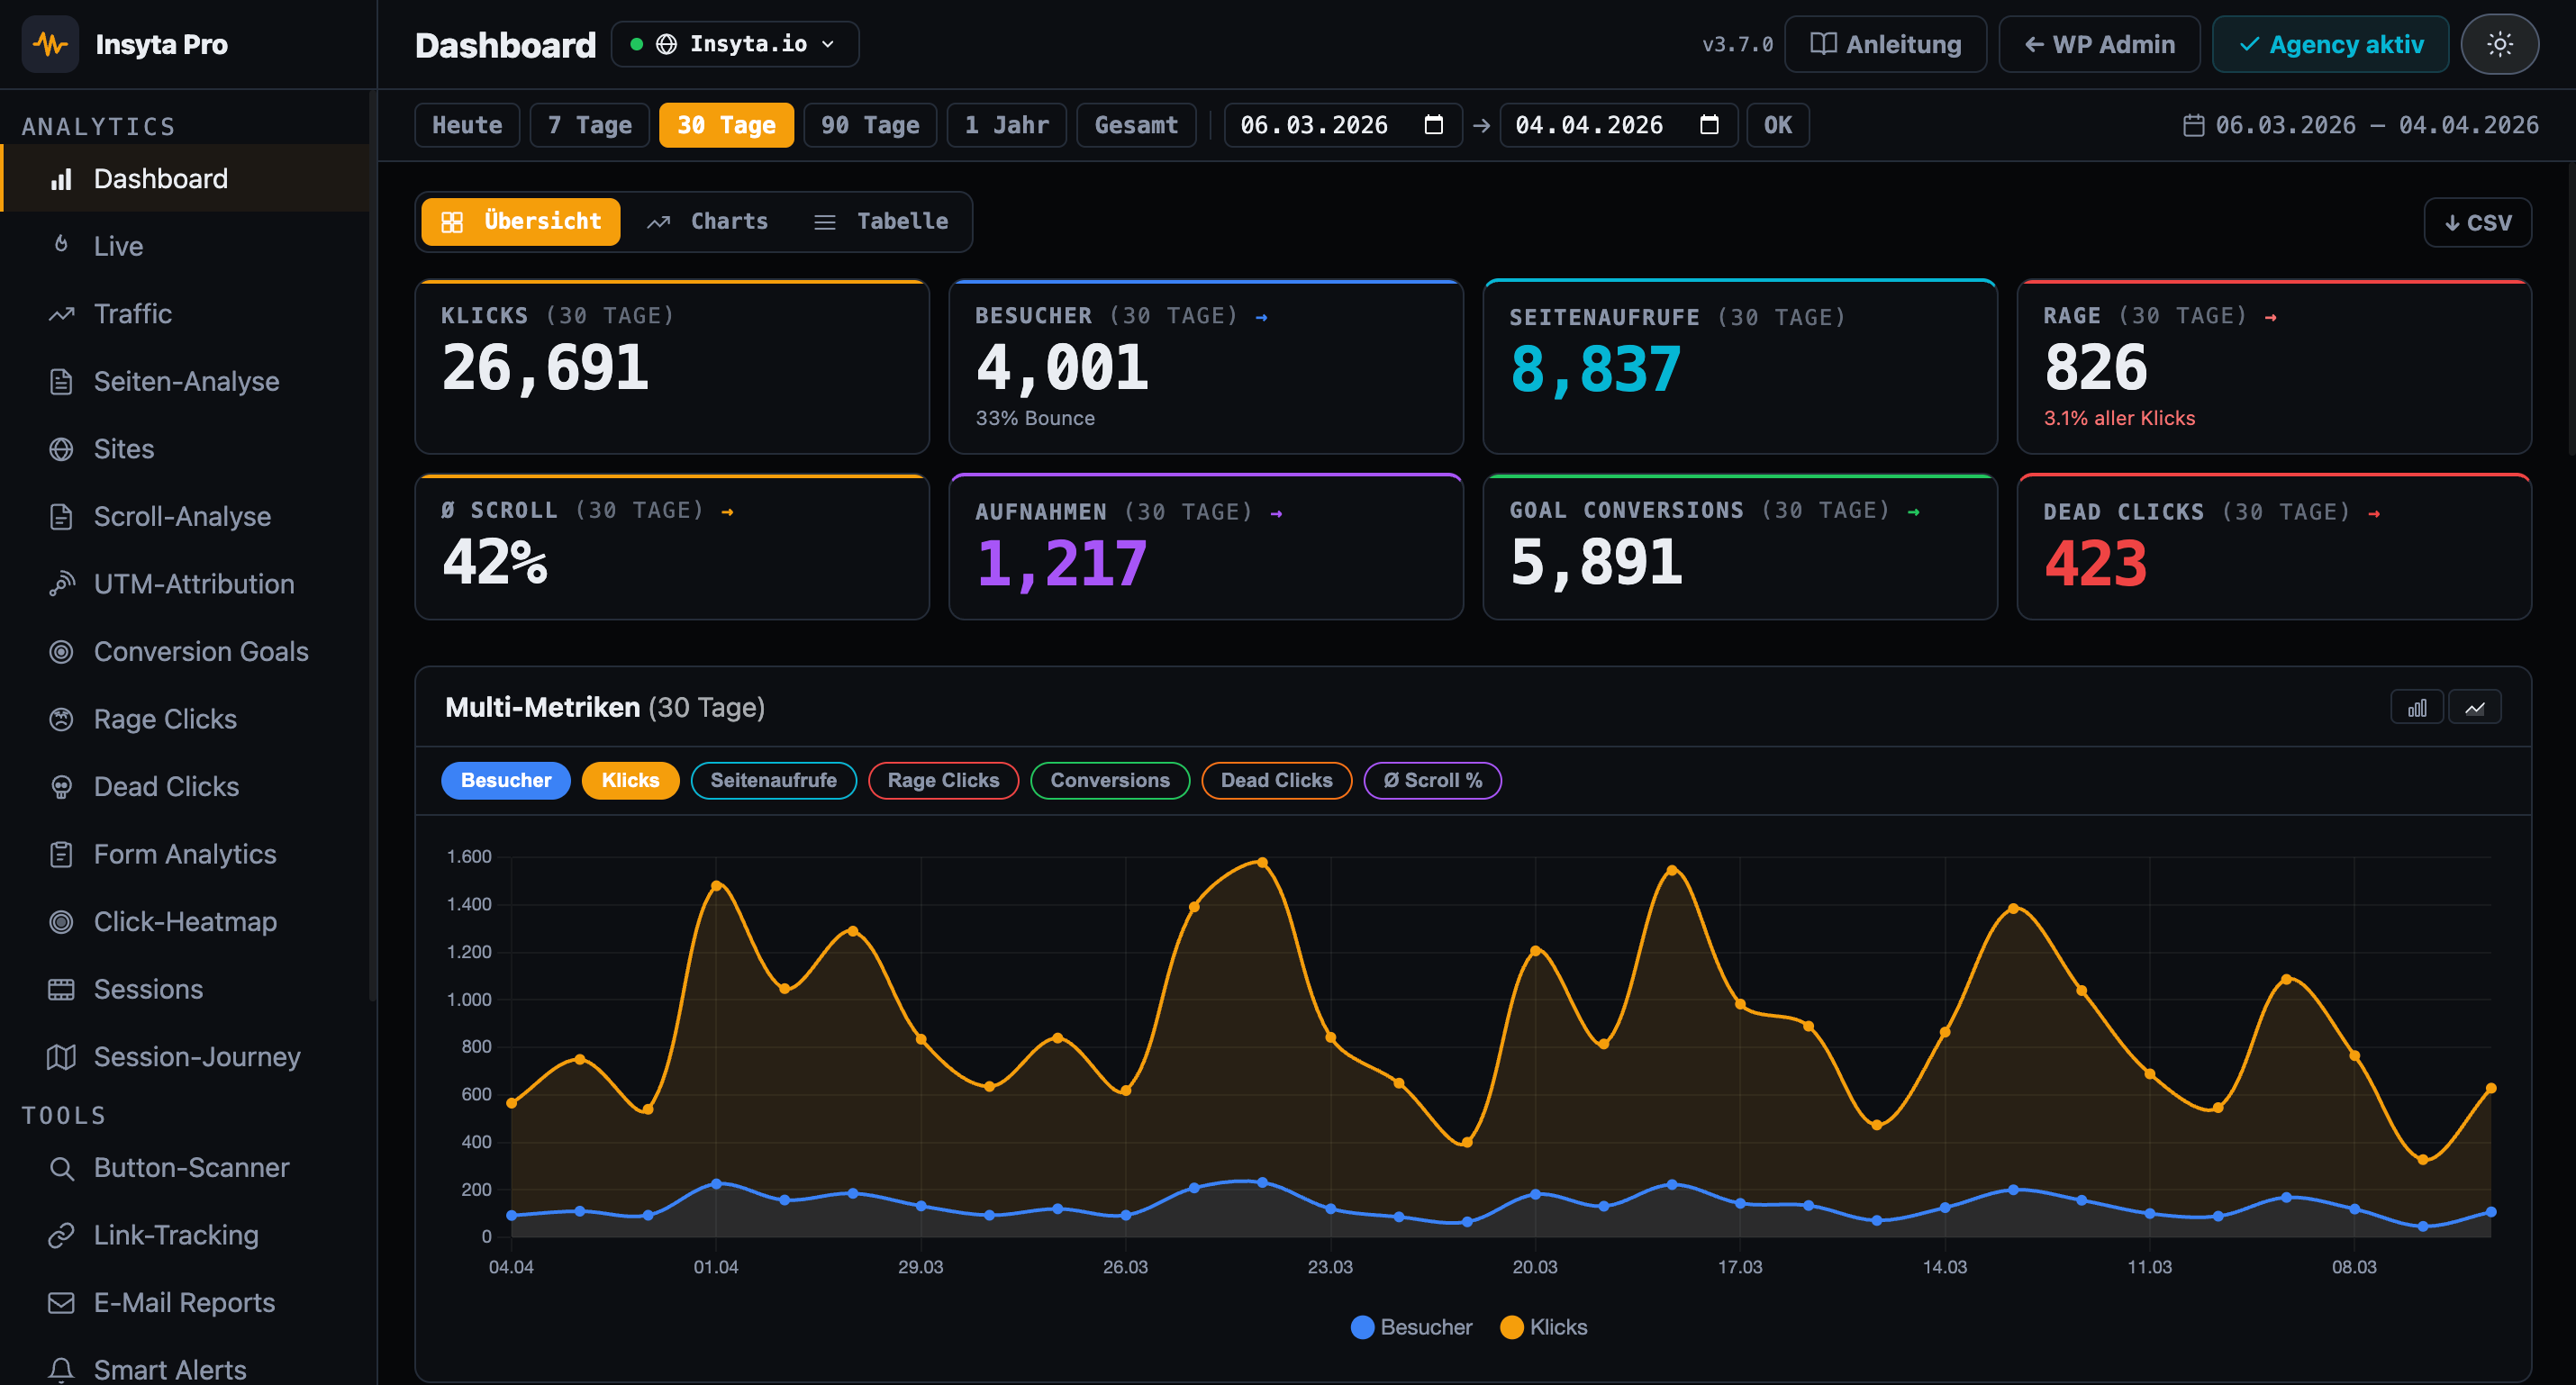
A scroll tracking plugin shows you how far users scroll on your pages. You see: How many reach the end? Where do most abandon? How long do they dwell in certain areas? Perfect for measuring content performance.
Insyta Pro vs. Google Analytics / Hotjar
Why Insyta Pro?
Google Analytics lacks heatmaps and session recordings. Hotjar costs 39 €/month. Insyta Pro starts at 6 €/month — 100% local, GDPR-compliant.
Feature
Insyta Pro
Hotjar
GA4+GTM
MS Clarity
Click tracking
✓
✓
✓ complex
✗
Click heatmap
✓ Canvas overlay
✓ from 39 €+/mo
✗
✓ US servers
Scroll tracking
✓ + Scroll Map
✓
✗
✓
Session recordings
✓ local
✓ from 39 €+/mo
✗
✓ US servers
Session journey
✓ local
✗
✗
✗
Real-time dashboard
✓ Live counter + sessions
✗
✓ but complex
✗
Rage click detection
✓
✓
✗
✓
Dead click detection
✓
✗
✗
✗
Form analytics
✓
partial
✗
✗
Conversion goals
✓
partial
✓ complex
✗
A/B test tracker
✓
✗
✗
✗
UTM attribution
✓
✗
✓
✗
Traffic analytics
✓
✗
✓
✗
Page analytics (per URL)
✓
✗
✗
✗
Dwell time per scroll zone
✓
✗
✗
✗
Email reports
✓
✗
✗
✗
Smart alerts
✓
✗
✗
✗
Funnel builder
✓
✗
✗
✗
Link & CTA tracking
✓
partial
✓ complex
✗
Button scanner
✓
✗
✗
✗
Multi-site dashboard
✓ Agency
✗
✗
✗
White-Label Addon
✓ Agency
✗
✗
✗
Self-hosted (your server)
✓ 100%
✗
✗
✗ Microsoft cloud
GDPR compliant / cookieless
✓
⚠ limited
⚠ limited
⚠ Microsoft data sharing
No data to third parties
✓
✗
✗
✗
WordPress-native
✓
✗
✗
✗
Price
from 6 €/mo
from 39 €/mo
Free + setup work
Free*
Features
What you get with Insyta Pro
Scroll Depth Analysis
Track 25% / 50% / 75% / 100% scroll milestones
Scroll Heatmap
Visualize where users dwell longest
Dwell Time per Zone
See how long users stay in each area
Device Segmentation
Mobile scrolls differently than desktop — see the differences
Content Performance
Which sections are read, which ignored?
Engagement Scores
Rate content quality based on scroll behavior
White-Label Addon ADDON
Custom branding, logo & colors for the plugin dashboard. Available separately for Agency licenses.
Perfect for
Who benefits from scroll tracking
Content Creators & Bloggers
See how far readers read your articles — and where you should shorten or make content more engaging.
Shop Owners
Find out if product descriptions are fully read or if the buy button is too far down.
Landing Page Optimizers
See exactly at which percentage visitors drop off and place your CTA strategically just before that point.
UX Designers
Recognize with dwell-time data per zone which areas of the page are actually read.
SEO-Spezialisten
Long articles with high scroll depth send positive signals to search engines — measure it directly.
Agencies
Deliver clients scroll reports with exact percentages per page — exportable as CSV.
Pricing
Subscribe monthly or pay once.
LAUNCH DEAL — LIMITED
Agency Lifetime + White-Label —
499 €149 €
All Agency features incl. White-Label Addon — unlimited sites, custom branding. Launch period only.
Wir verwenden Cookies und ähnliche Technologien (z. B. Pixel, Tags, Skripte), um Ihnen die bestmögliche Erfahrung auf unserer Website zu bieten. Einige davon sind technisch notwendig für den Betrieb der Seite, während andere uns helfen, die Website zu verbessern, Inhalte zu personalisieren und Werbung auszuspielen.
Im Rahmen der Nutzung unserer Website können personenbezogene Daten (z. B. IP-Adresse, Geräteinformationen, Nutzungsverhalten) erhoben, an Drittanbieter übermittelt und von diesen verarbeitet werden — auch in Ländern außerhalb der EU/des EWR (z. B. USA), in denen kein gleichwertiges Datenschutzniveau gewährleistet ist (Art. 49 Abs. 1 lit. a DSGVO). Mit Ihrer Einwilligung stimmen Sie auch dieser Datenübermittlung ausdrücklich zu.
Einige Verarbeitungen können auf Grundlage eines berechtigten Interesses (Art. 6 Abs. 1 lit. f DSGVO) erfolgen. Sie können Ihre Einwilligung jederzeit mit Wirkung für die Zukunft widerrufen oder Ihre Einstellungen anpassen, indem Sie diese Cookie-Einstellungen erneut öffnen.
Weitere Informationen finden Sie in unserer Datenschutzerklärung. Die Nutzung dieser Website setzt ein Mindestalter von 16 Jahren voraus.
Die Ablehnung ist jederzeit möglich und hat keine Nachteile für die Nutzung der Website (Art. 7 Abs. 4 DSGVO). Details zu den einzelnen Cookies und Technologien finden Sie in den Kategorien unten.
Notwendig(5)▼
consenta_authconsent.js6 monate
HMAC-SHA256-signiertes Auth-Cookie für die kryptographisch sichere serverseitige Consent-Verifikation. HttpOnly und Secure — für JavaScript nicht lesbar, kein XSS-Leak möglich. Wird nach erfolgreichem Consent-Log gesetzt und von API::has_consent() für PHP-seitige Consent-Prüfungen gelesen.
consenta.iodomain
insyta_api_tokenInsyta30 tage
Optionaler API-Token für License-Server.
insyta_customerInsyta30 tage
Insyta-Kunden-Login-Session.
usprivacyconsent.js1 jahr
Speichert den CCPA-Datenschutzstatus des Nutzers gemäß dem IAB US Privacy Framework.
Funktional(5)▼
//fonts.googleapis.comGoogle
Google APIs für verschiedene Dienste wie Maps, Fonts und YouTube
//fonts.gstatic.comGoogle
Google Static Content Delivery für Ressourcen und Bibliotheken
gstatic.comGoogle
Google Static Content Delivery für Ressourcen und Bibliotheken
https://fonts.gstatic.comGoogle
Google Static Content Delivery für Ressourcen und Bibliotheken
insyta_p_utmtracker-pro.js
Statistiken(14)▼
_gaGoogle Site Kit2 jahre
Unterscheidet eindeutige Nutzer durch Zuweisung einer zufällig generierten Nummer als Client-Kennung für Google Analytics.
_ga_*Google Site Kit2 jahre
Speichert den Session-Status und wird zur Berechnung von Besucherdaten für GA4-Berichte verwendet.
_gatGoogle Site Kit1 minute
Begrenzt die Anfragerate an Google Analytics, um die Datenerfassung auf Websites mit hohem Besucheraufkommen zu drosseln.
_gat_*Google Site Kit1 minute
Wird von Google Analytics verwendet, um die Anfragerate zu drosseln. Enthält die Tracker-ID im Cookie-Namen.
_gcl_auGoogle Site Kit90 tage
Wird von Google AdSense zur Optimierung der Werbewirksamkeit auf Websites verwendet.
_gcl_awGoogle Site Kit90 tage
Speichert Conversion-Informationen von Google Ads Klicks zur Messung des Werbeerfolgs.
_gidGoogle Site Kit24 stunden
Unterscheidet Nutzer und speichert Informationen über den Seitenbesuch für 24 Stunden.
//www.googletagmanager.comGoogle
Google Tag Manager zur Verwaltung von Tracking-Tags und Skripten
Google Analytics (inline)Google
google-analytics.comGoogle Site Kit
Google Analytics Tracking-Dienst für Website-Analyse
googleapis.comGoogle Site Kit
Google APIs für verschiedene Dienste wie Maps, Fonts und YouTube
googlesyndication.comGoogle Site Kit
Google AdSense Werbenetzwerk für die Anzeigenauslieferung
googletagmanager.comGoogle Site Kit
Google Tag Manager zur Verwaltung von Tracking-Tags und Skripten